
Stakeholder mapping that goes beyond the grid
Most teams map stakeholders once, on a spreadsheet, and never update it. Tractivity's stakeholder mapping module is live, connected, and built to track how relationships evolve over the life of a project.


What Tractivity's stakeholder mapping actually does
Tractivity lets you score every stakeholder against attributes you define (interest, influence, engagement, sentiment, relationship, reputation, relevance) and automatically generate visual bubble and scatter charts. You can compare up to three attributes simultaneously, track how scores change across project phases, and export any map as a PDF or Excel file.
It's not a standalone tool. Stakeholder mapping in Tractivity is connected to your contact records, engagement history, issue log, and communications. So the picture your map shows is always based on live data, not a snapshot you made six months ago.

- Set attributes
- Create maps
- Add phases
- Analyse
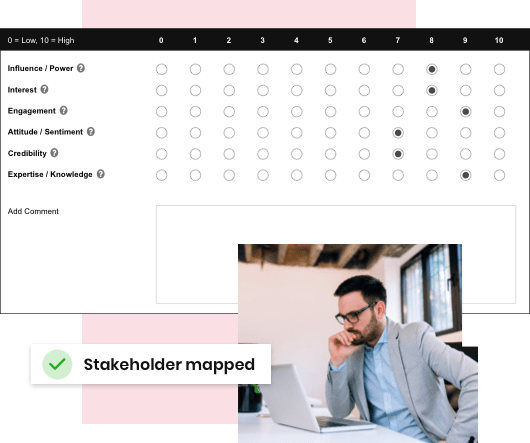
Score stakeholders on the criteria that matter
Define the attributes relevant to your project and score each stakeholder against them. Tractivity includes standard attributes like interest, influence, sentiment, and relationship. But you can create any criteria that fit your engagement objectives.
Every stakeholder gets a score against each attribute, giving you a consistent, comparable dataset across your entire stakeholder group.
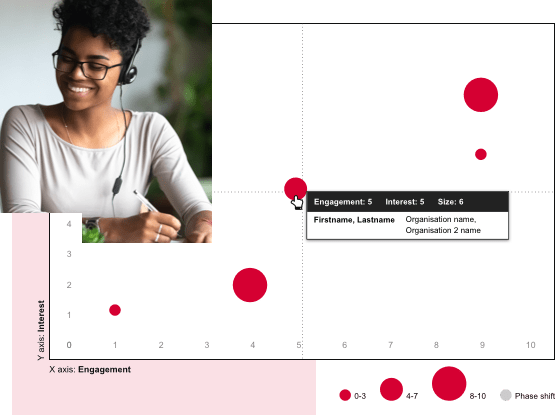
Visual maps: bubble charts and scatter charts
Generate bubble charts and scatter charts that plot your stakeholders visually. Compare up to three attributes at once. For example, engagement on the X axis, interest on the Y axis, and influence as bubble size. Hover over any point to see the stakeholder's name, organisation, and scores. Switch attribute combinations instantly. Save as many maps as your project needs.
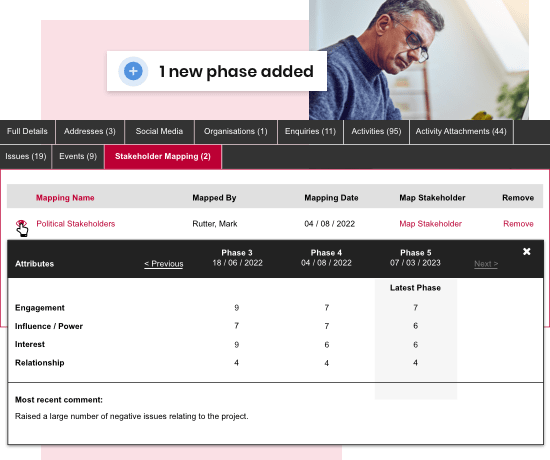
Phase tracking: see how positions shift over time
Add project phases to your mapping. As many as your project requires. Tractivity records stakeholder scores at each phase, so you can compare where a stakeholder stood at Phase 3 versus Phase 5.
You can see attribute-by-attribute score changes in a table view, alongside the most recent comment logged against that stakeholder. This is how engagement teams demonstrate progress, and spot problems, before they escalate.
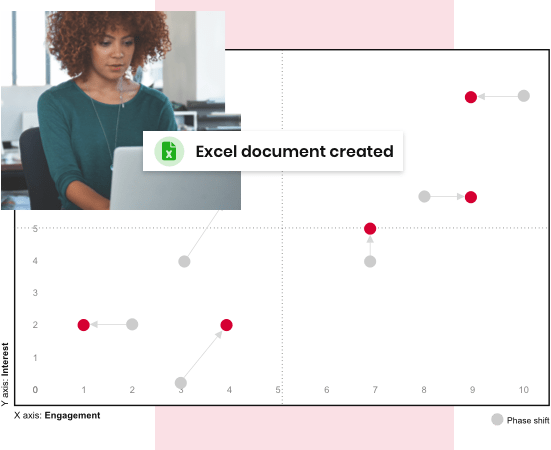
Evolution analysis and export
When you're ready to report, Tractivity shows you a visual of how each stakeholder's position has shifted between phases, red dots for current position, grey for previous, with connecting lines showing direction of travel.
Save your analysis and export the complete map as a PDF or Excel file for leadership briefings, regulatory reporting, planning appeals, or project audits.

Not just a map – a connected view of your stakeholders
A map is only useful if the data behind it is current. Because stakeholder mapping in Tractivity sits inside your SRM platform, scores can reflect what's actually happening: new issues logged, recent engagement activity, consultation responses received. From any map, you can build distribution lists based on scores and send targeted communications directly. No exporting, no switching tools.

Trusted by leading organisations
Tractivity is used by leading organisations across energy, water, transport, healthcare, and government across Ireland and the UK, including the Institute of Bankers in Ireland, Severn Trent, UK Power Networks, SGN, Northumbrian Water, Department for Transport, SP Energy Networks, Electricity North West, and NHS trusts across England.


The complete guide to stakeholder mapping

Stakeholder analysis: a practical framework

What is stakeholder management software?
